
Segregation occurs when certain groups in a community are separated or isolated from the broader community. Segregation often occurs based on community characteristics — especially race, income, religion, sex, familial status, natural origin, or disability. In contrast, integration occurs when there is no disproportionate concentration of persons with specific characteristics (e.g., race, income, religion) when compared to the broader geographic area. In 1968, Congress enacted the Federal Fair Housing Act to prohibit discrimination in housing sales, rentals, and financing. This legislation was later expanded to address the segregated housing context that existed across American cities. Residential segregation has persisted due to several factors that have reinforced exclusionary patterns. Community opposition, displacement due to economic pressures, immigration patterns, land use and zoning laws, and a lack of investment in certain neighborhoods contribute primarily to segregation.
As part of California’s effort to affirmatively further fair housing, the State now requires all cities and counties to identify and analyze local segregation and integration patterns through the housing element fair housing assessment. This analysis must include a current and historic look at local demographic data and segregation patterns, including identification of areas of ongoing and concentrated segregation and integration, and a comparison of local and regional patterns. At a minimum, analysis should address levels of segregation and integration for race and ethnicity, income, familial status, and persons with disabilities, and should include an identification of the groups that experience the highest levels of segregation. By effectively analyzing segregation and integration within the fair housing assessment, public agencies can appropriately inform fair housing policies and actions.
Relevant State Laws
Assembly Bill 686 (AB 686) expands on the fair housing requirements and protections outlined in the California Fair Employment and Housing Act (FEHA). AB 686 requires that public agencies affirmatively further fair housing by assessing existing housing market conditions within their jurisdictions and provide effective policy and program changes to mitigate issues. To enable this assessment and mitigation, the law requires fair housing assessments in the housing element beginning January 1, 2021. The fair housing analysis must use available Federal, State, and local data to address a variety of factors, including:
- Integration and segregation
- Racially or ethnically concentrated areas of poverty
- Disparities in access to opportunity, including for person with disabilities
- Disproportionate housing needs, including displacement risk
AB 686 also requires programs and policies to promote fair housing opportunities. Additionally, all public agencies must administer housing and community development programs and activities to be consistent with AFFH. These policies and programs must then be supported by identifying quantifiable metrics for determining what fair housing results will be achieved.
Relevance to the San Joaquin Valley
The San Joaquin Valley is home to a significant Hispanic/Latino community, making up over 50 percent of the regional population (U.S. Census 2020). Location-based differences between predominantly White populations and predominantly Hispanic populations across the region may be indicative of large-scale trends in segregation, although the origins of predominately some Hispanic cities (e.g., Arvin, Huron, San Joaquin) may have more nuanced or complex explanations. Public agencies should analyze local demographics in relation to regional patterns to identify areas of segregation and inform policies for furthering fair housing opportunity and integration. The figure below depicts the Hispanic majority and White majority census tracts within the San Joaquin Valley.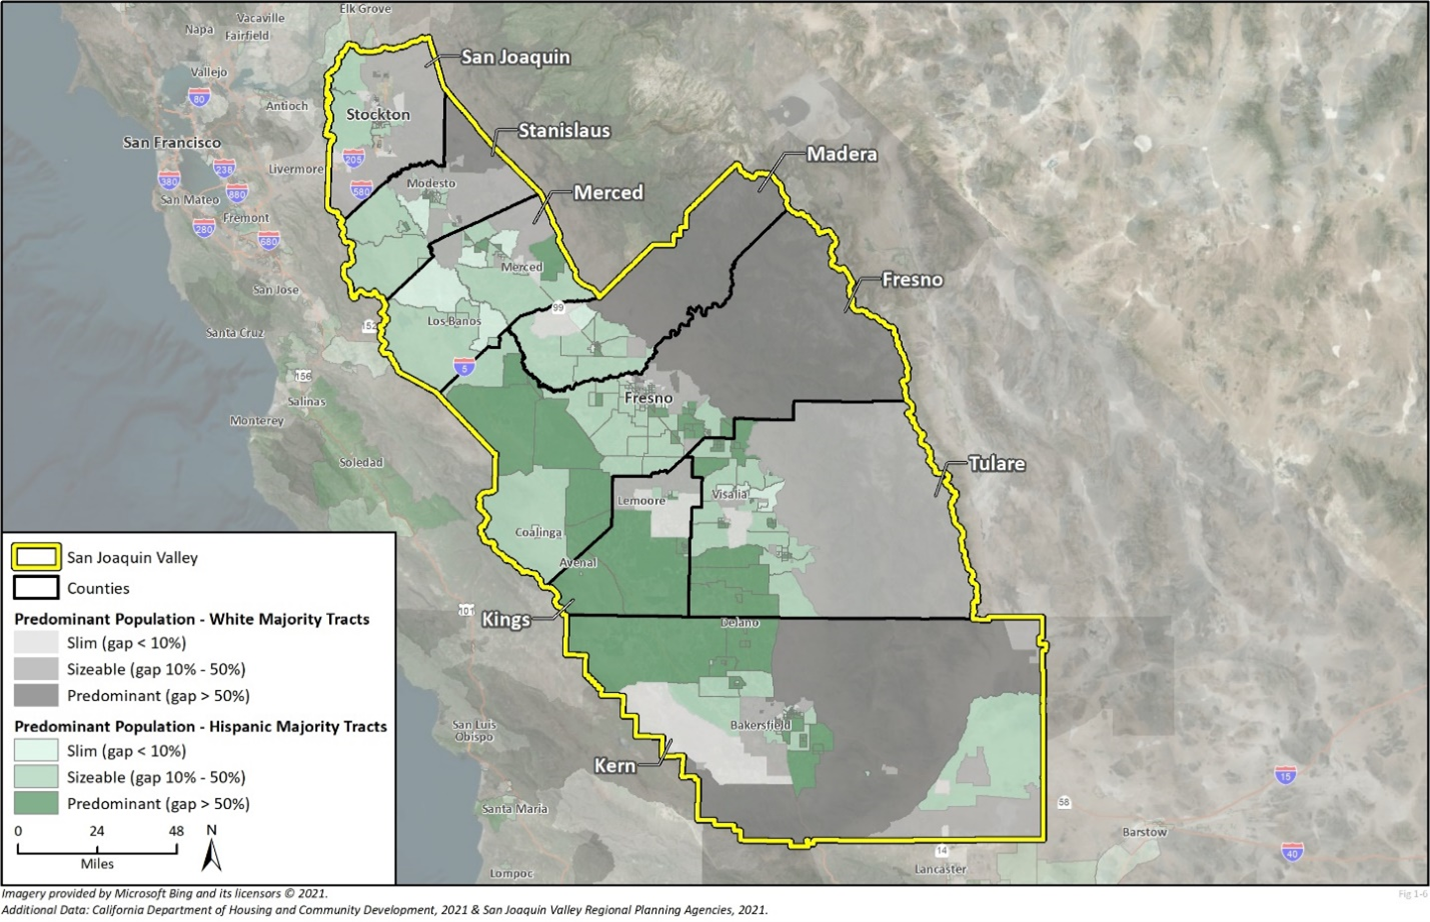
By assessing current and historic trends related to race, ethnicity, and other community characteristics, public agencies within the San Joaquin Valley can effectively determine local patterns of segregation related to housing and whether those patterns are the result of, or could result in, fair housing access for all populations. Through focused policies targeted toward equitable housing, agencies can promote integration and ensure fair housing practices within their jurisdiction.
Resources
AFFH Data Viewer. HCD’s AFFH Data Viewer is an interactive resource that can determine local and regional patterns related to AFFH. The Data Viewer consists of mapped data layers organized by the different, mandatory AFFH assessment levels. Local agencies can use the segregation and integration data layer to view different indicators that may aid in assessing the local segregation context. These indicators include, but are not limited to, the following:
- Median income
- Poverty status
- Neighborhood segregation
- Population with a disability
- Diversity index
- Low to moderate income population (HUD)
Racial/Ethnic Qualitative Metrics. To prepare an effective segregation and integration analysis, jurisdictions must quantify the extent of segregation within their communities. The U.S. Census American Community Survey uses two quantitative metrics to analyze the relative extent of racial and ethnic segregation within a community as compared to regional trends: the dissimilarity index and the isolation index. Both quantitative metrics serve to identify geographic segregation patterns. The dissimilarity index measures the percentage of a group’s population that would have to change residence for each subarea to have the same percentage of that group as the broader geographic area. The index ranges from 0 to 100, with 0 meaning no segregation and 100 indicating complete segregation between the two groups. The isolation index compares a group’s share of the overall population to the average share within a given subarea. The isolation index ranges from 0 to 100, with values closer to zero indicating that members of that group live in more integrated neighborhoods. Jurisdictions should use both indices to compare trends regionally (local versus regional trends) and locally (trends between Census tracts and block groups). Data to calculate the dissimilarity index and isolation index are available at the Census tract or block group level from the American Community Survey: https://www.census.gov/programs-surveys/acs/data.html.
Mapping Lower-Income Households. Jurisdictions can map concentrations of low- and moderate-income (LMI) households within the segregation and integration component of the fair housing assessment to identify where unique pockets of LMI are located and develop targeted mitigation strategies. Data for this analysis is available through the U.S. Department of Housing and Urban Development (HUD) via the Low- and Moderate-Income Summary Data (LMISD): https://www.hudexchange.info/programs/acs-low-mod-summary-data.
Mapping Inequality Tool. The Mapping Inequality Tool provides insight into historic redlining practices within communities across the United States. Redlining was a historic practice of furthering segregation by refusing to insure mortgages in and near Black neighborhoods. Biased mortgage security maps strategically segregated Black populations from white communities. The Mapping Inequality tool depicts Home Owners’ Loan Corporation (HOLC) maps that were color coded to reflect the mortgage security potential of various neighborhoods. San Joaquin Valley jurisdictions can use these historic maps in their fair housing assessments to provide historic context for current segregation patterns. This tool is available at https://dsl.richmond.edu/panorama/redlining/#loc=5/39.1/-94.58