
Defining the Federal Housing and Urban Development (HUD) Department’s Racially/Ethnically Concentrated Areas of Poverty (R/ECAP) involves both a racial/ethnic concentration threshold and a poverty test. The racial/ethnic concentration threshold must have a non-White population of 50 percent or more within a metropolitan or a micropolitan area. Outside of these areas, where the non-White populations are likely to be much smaller, the threshold is set at 20 percent. A neighborhood (Census tract) can also be a R/ECAP if it has a poverty rate that exceeds 40 percent or more or is three or more times the average tract poverty rate for the metropolitan/micropolitan area, whichever threshold is lower.
The State’s 2020 Analysis of Impediments (AI) found that in 2017, the State had 391 racially and ethnically concentrated areas of poverty (R/ECAP) areas, which represents a notable 40 percent increase from the 278 R/ECAP areas documented in 2010. Between 2000, when the state had 182 R/ECAP areas, and 2017, California has seen a 115 percent increase in R/ECAP areas. The HCD guidance memo identifies the following as examples of contributing factors to R/ECAPs:
- Community opposition
- Deteriorated and abandoned properties
- Resident displacement due to economic pressures
- Few community revitalization strategies
- Few private investments in specific neighborhoods
- Few public investments in specific neighborhoods, including services or amenities
- Little regional cooperation
- Land use and zoning laws
- Location and type of affordable housing
- Occupancy codes and restrictions
- Private discrimination
- Lending discrimination
- Policing and criminalization
Updated housing elements must include R/ECAP analyses. Concentrated areas of poverty must be discussed relative to the region, as well as within the jurisdiction. The analysis should also consider concentrated areas of affluence to better evaluate trends, patterns, policies, and practices and to guide meaningful goals and actions to address fair housing issues. The analysis should aim to replace segregated living patterns with truly integrated and balanced living patterns and to transform R/ECAPs into areas of opportunity.
Relevance to Housing in the San Joaquin Valley
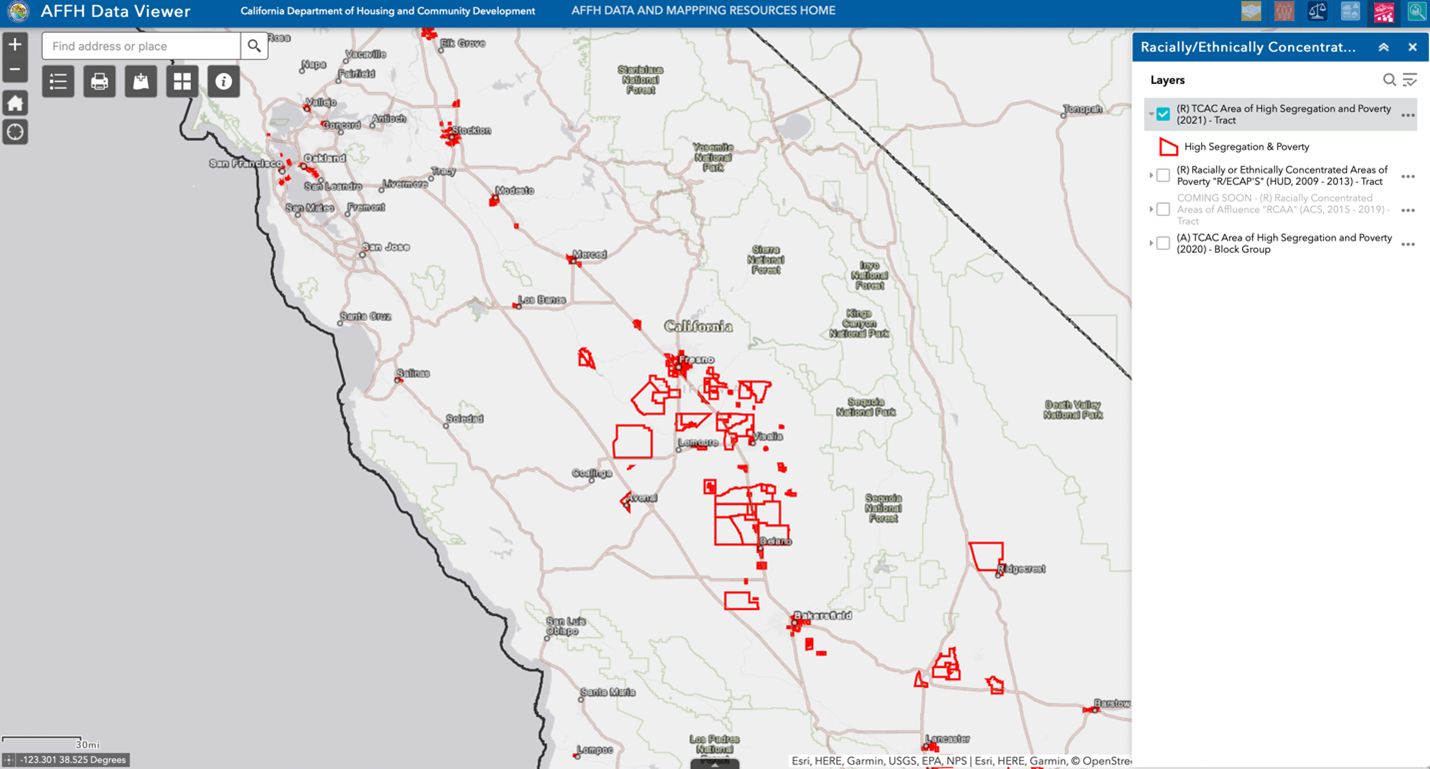
R/ECAP areas are present in most of the larger cities and are more commonly found in central and southern San Joaquin Valley cities and counties as shown on the following maps.
Areas of High Segregation and Poverty
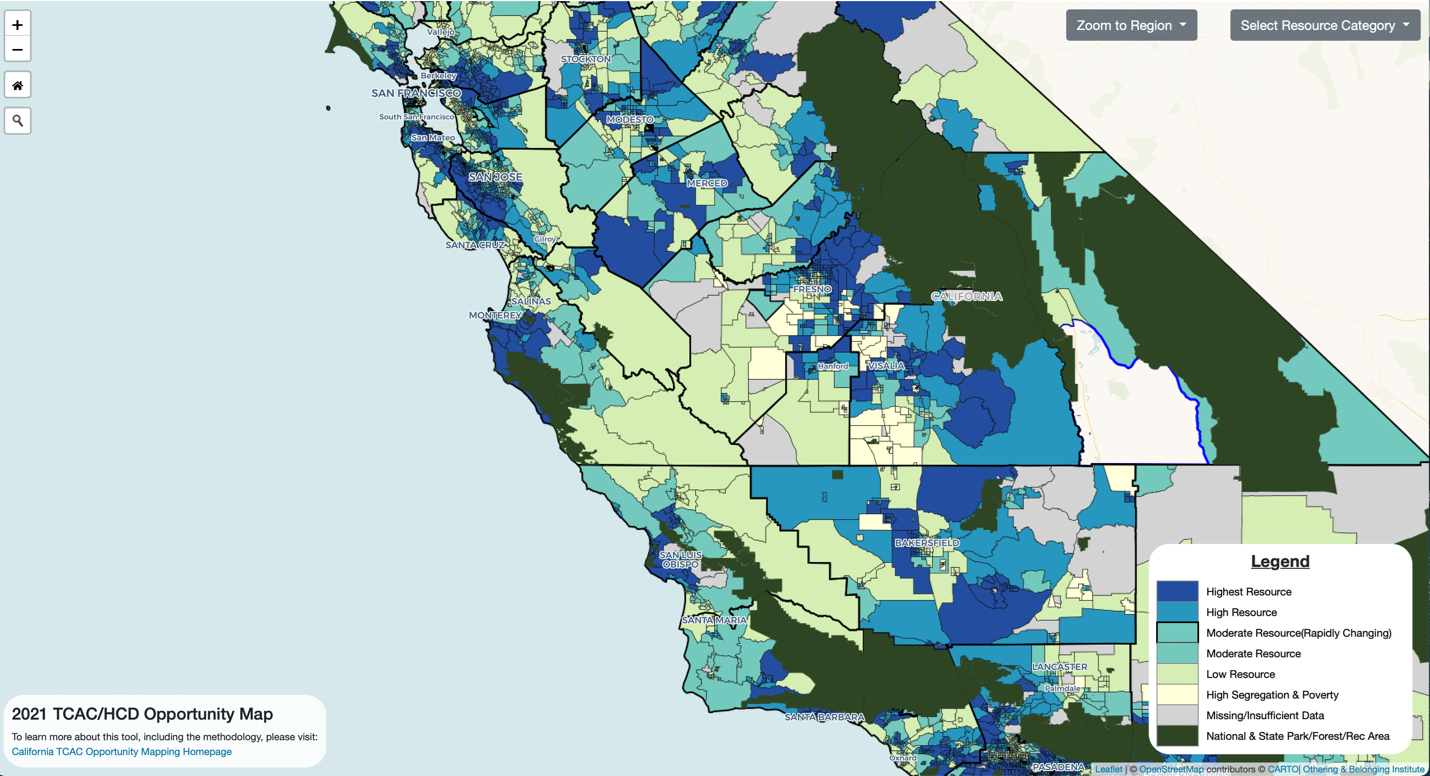
Opportunity Map (Level of Resources)
For those jurisdictions (and surrounding regions) with R/ECAPs, housing elements must identify factors that create, contribute to, perpetuate, or increase the severity of R/ECAP and then develop policies and prioritize actions to transform R/ECAPs into areas of opportunity. Each jurisdiction and R/ECAP area may be influenced by different factors and require differing interventions to effectuate the desired transformations.
R/ECAP Resources:
U.S. Department of Housing and Urban Development, The R/ECAP database.
Office of the State Treasurer, TCAC/HCD Opportunity Map: The High Segregation & Poverty category in the TCAC/HCD Opportunity Area Map may also be used in identifying R/ECAPs.
California Department of Housing and Community Development, Concentrated Areas of Affluence (RCAA) map and accompanying data (noted as “coming soon”) can be accessed using the AFFH Data Viewer.
Supplemental Data
Quantitative data is critical to a comprehensive and regulatory compliant housing element. Recent developments in State housing regulation have expanded the housing element requirements for public agencies to include an assessment of fair housing per the Affirmatively Further Fair Housing (AFFH) regulation. Quantitative data enables public agencies to analyze the mandatory topics within the AFFH assessment in a more objective and measurable manner. To develop an adequate housing element and fair housing assessment, public agencies can rely on AFFH data provided by HCD, as well as supplemental data provided by external resources. Integrating both options will provide a more local context to adequately assess fair housing and develop appropriate housing policy.
Relevant State Law
Assembly Bill 686 (AB 686) expands on the fair housing requirements and protections outlined in the California Fair Employment and Housing Act (FEHA). AB 686 requires that public agencies affirmatively further fair housing by assessing the housing context within their jurisdictions and making effective policy and program changes to mitigate issues. To assist this assessment and mitigation, the law mandates fair housing assessments as part of the housing element beginning January 1, 2021. The fair housing analysis must use available Federal, State, and local data to analyze a variety of factors. These include:
- Integration and segregation
- Racially or ethnically concentrated poverty areas
- Disparities in accessing opportunities, including for person with disabilities
- Disproportionate housing needs, including displacement risk
AB 686 requires new or modified programs and policies to promote fair housing opportunities. These policies and programs must then be supported by identifying metrics or quantifiable objects for determining what fair housing results will be achieved.
San Joaquin Valley Experience
To meet the regulatory requirements for the AFFH assessment, Valley agencies must assess impediments to affirmatively furthering fair housing within their jurisdiction. These impediments include disparities in accessing opportunities, segregation and integration, racially or ethnically concentrated areas of poverty, and disproportionate housing needs. Quantitative data tools in the AFFH Data Viewer will help inform the housing element update process and supply information to better understand the local impediments to housing production.
HCD AFFH Data Viewer
Navigating the AFFH Data Viewer, users can explore key data sets and demographic maps that will enable them to qualitatively assess integration and segregation, racially or ethnically concentrated poverty areas, disparities in accessing opportunities, and disproportionate housing needs.
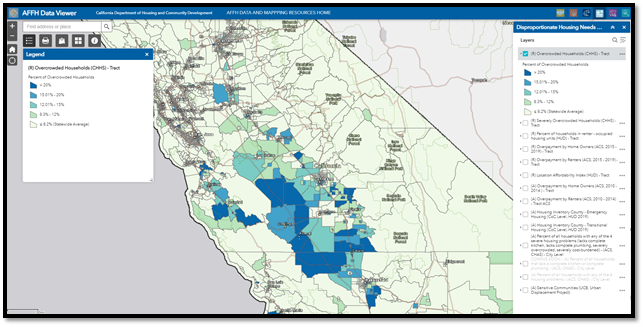
The figure below depicts a snapshot of the AFFH data viewer. Data layers are shown in the top right corner and correspond to requirements for the AFFH analysis: disproportionate housing needs/displacement risk, fair housing enforcement and outreach capacity, segregation and integration, disparities in access to opportunities, racially/ethnically concentrated areas of poverty, and supplemental data. The metrics provided can further enable the AFFH assessment by providing additional context for community patterns and demographics. The data layer options for the supplemental data layer include the Social Vulnerability Index, CalEnviroScreen, Healthy Places Index, and SB 535 Disadvantaged Communities.
AFFH Data Viewer
Supplemental Data Tools
Social Vulnerability Index. The Agency for Toxic Substances and Disease Registry (ATSDR) established the Social Vulnerability Index through its Geospatial Research, Analysis, and Services Program (GRASP). The assists emergency response planners and public health officials identify and map communities that are more likely to need support before, during, and after a hazardous event. This index uses 15 social factors that include poverty, lack of vehicle access, and crowded housing. These factors are grouped together to assign a ranking. The index may help inform the housing element update by contributing to the decision-making process regarding emergency shelters and housing locations.
The figure below depicts the Valley’s Social Vulnerability Index. Census tracts with higher ratings are considered more socially vulnerable. Communities in the west are more likely to rank high on the Social Vulnerability Index. Agencies with high-ranking communities can use the Social Vulnerability Index mapper to determine areas for emergency resource allocation related to housing.
Social Vulnerability Index San Joaquin Valley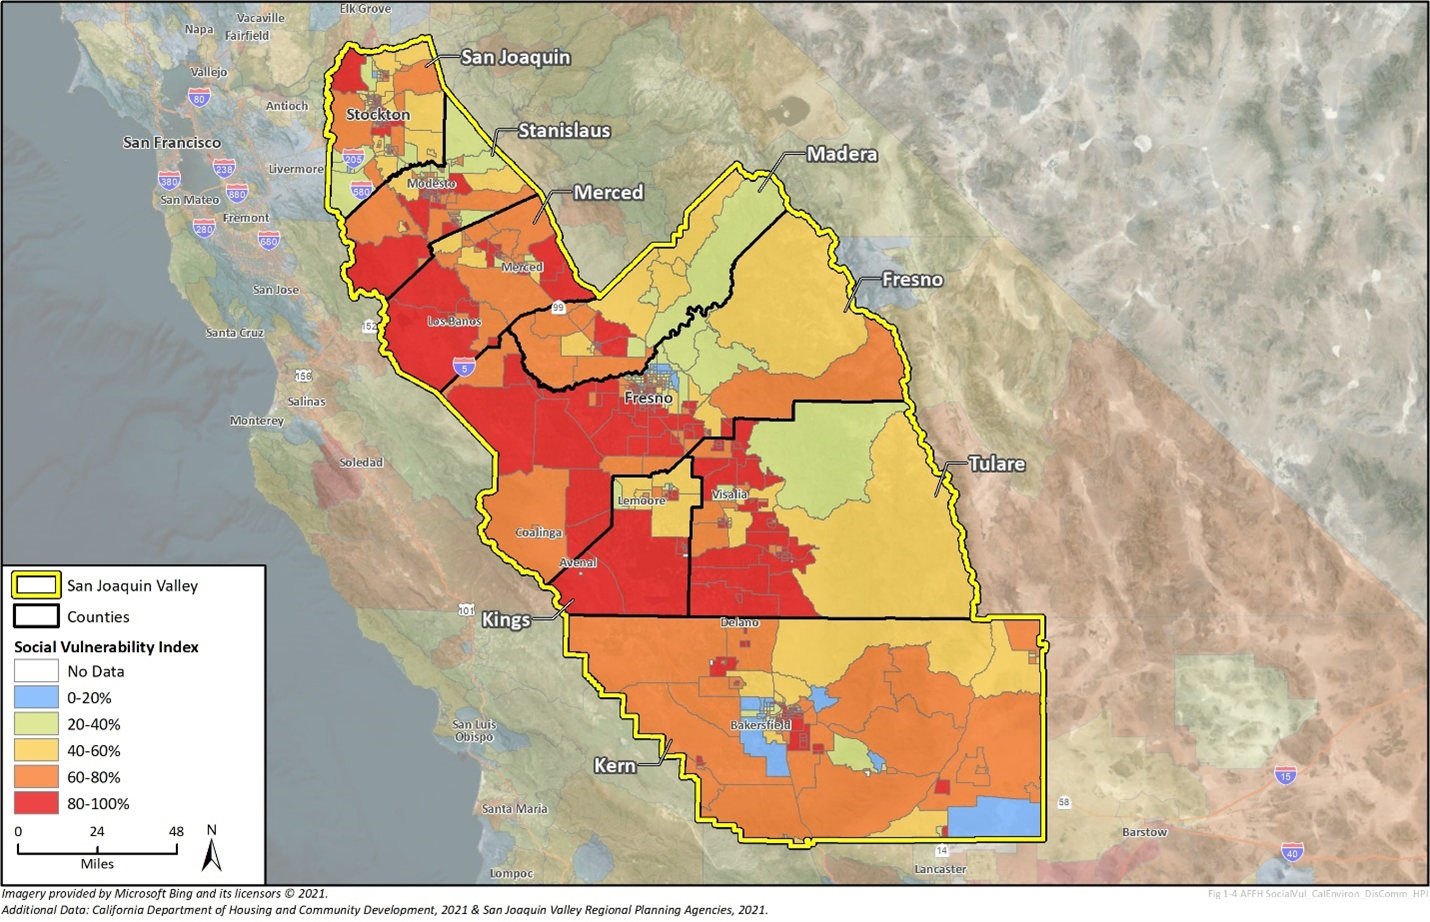
Healthy Places Index (HPI)
The Public Health Alliance of Southern California developed the Healthy Places Index (HPI), a supplemental data tool, in partnership with the Virginia Commonwealth University’s Center on Society and Health. The tool predicts life expectancy based on community conditions. Community condition indicators include economic stability, neighborhood and built environment, health and access to health care, education, social and community context. The Healthy Places Index provides a single health metric for each Census tract using 25 community characteristics.
The figure below shows a map of the HPI metrics for the San Joaquin Valley. Higher HPI values indicate healthier conditions. The San Joaquin Valley has predominantly low HPI values for Census tracts located in the west. Valley agencies can use HPI to determine which areas may have more disparities in opportunity. This information can inform the AFFH assessment of fair housing and contribute to determining where housing resources should be allocated.
Healthy Places Index San Joaquin Valley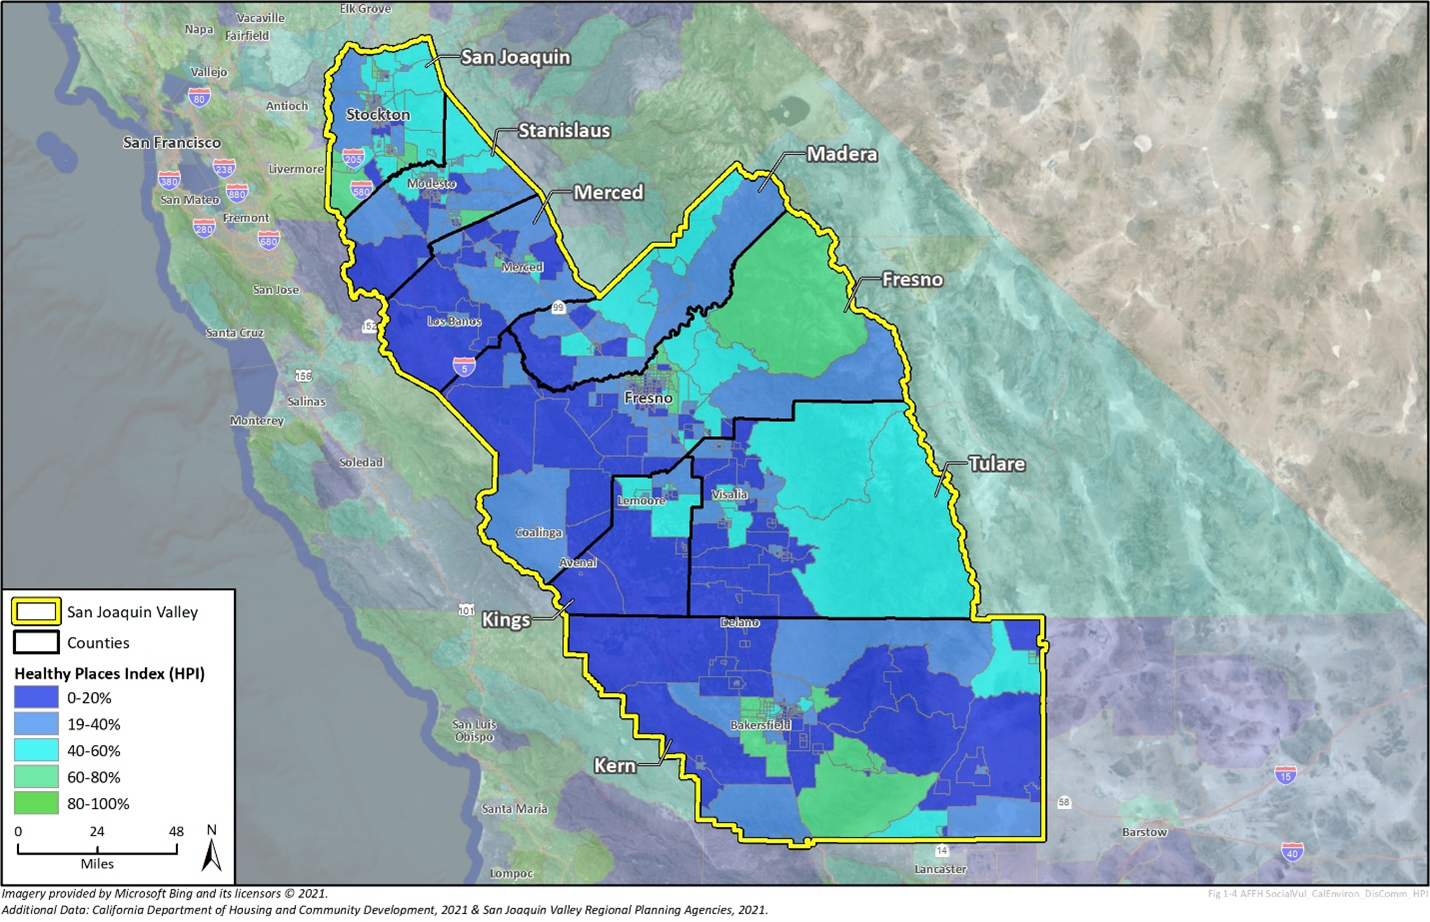
CalEnviroScreen
CalEnviroScreen is a mapping tool that identifies pollution and high environmental hazard exposure areas by Census tract. The tool indicates a community’s vulnerability to environmental pollution in relation to its designation as an SB 535 disadvantaged community. CalEnviroScreen illustrates data using percentiles to compare Census tracts across the entire state. Each Census tract can display the tract number, population, CalEnviroScreen score, and the percentile range. The lowest scores (1-10 percent) indicate lower pollution impacts and higher scores (91-100 percent) indicate higher impacts in comparison to the broader state.
The figure below depicts the CalEnviroScreen percentiles for San Joaquin Valley Census. A large majority of those tracts have a CalEnviroScreen score at the 70th percentile or higher. Housing location relative to pollution exposure is critical to a community’s health. Using CalEnviroScreen, public agencies can plan local housing in a manner that minimizes pollution exposure.
CalEnviroScreen Percentiles San Joaquin Valley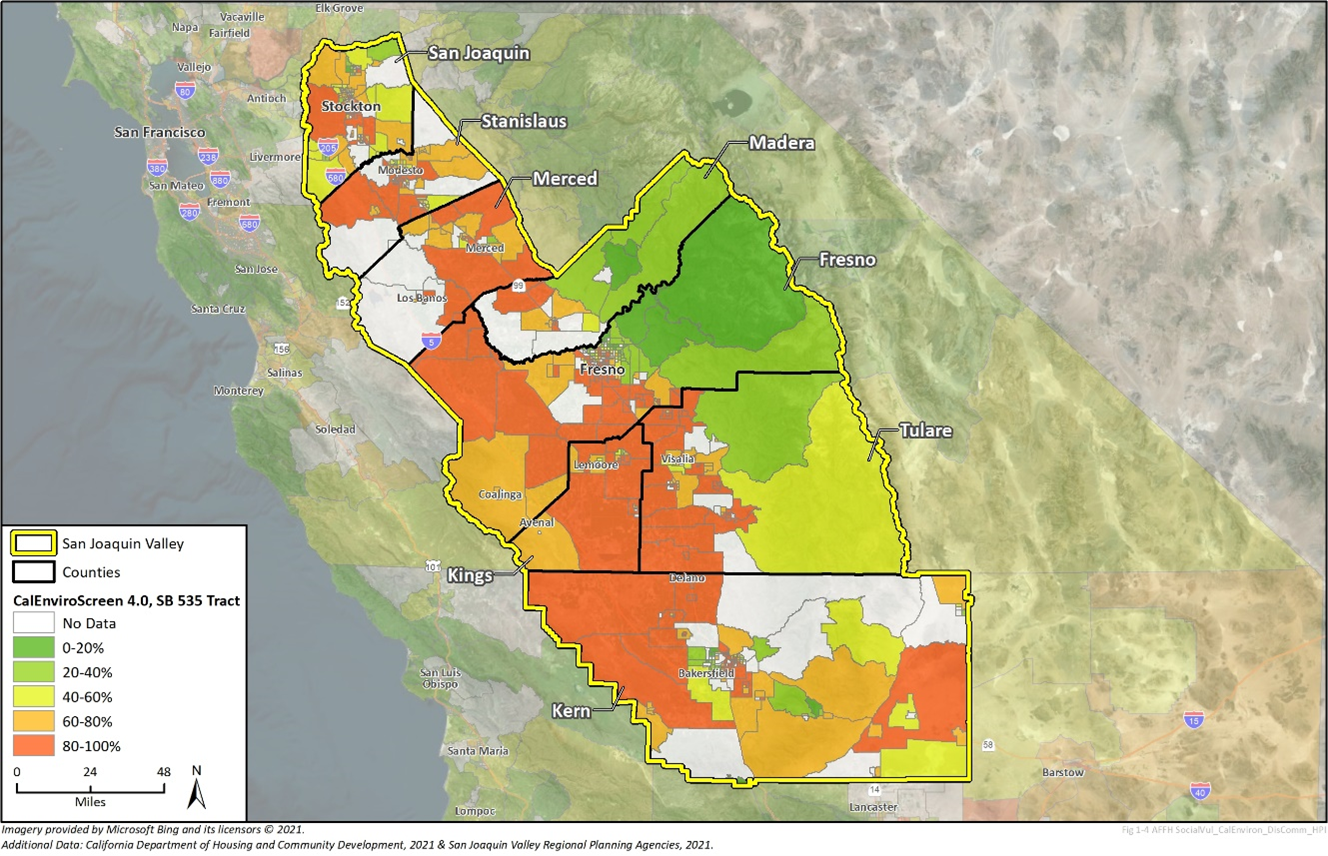
Sources
California Office of Environmental Health Hazard Assessment, SB 535 Disadvantaged Communities (June 2017).
California Department of Housing and Community Development, Affirmatively Furthering Fair Housing (April 2021).
California Department of Housing and Community Development, AFFH Data and Mapping Resources.
Agency for Toxic Substances and Disease Registry, CDC/ATSDR SVI Fact Sheet.